Missing mammalian morphologies?
 This post was originally written by my ex-PhD student Thomas Guillerme after the publication of this paper. The accompanying paper has now been published here as part of Special Feature for Biology Letters on Putting Fossils In Trees: Combining Morphology, Time, and Molecules To Estimate Phylogenies and Divergence Times. I’m reposting this blog post in an effort to make sure each paper I publish has a blog post to go with it! See the Paper 2 section below for the update including analyses from the new paper.
Paper 1 (Thomas)
After a few ups and downs, everything you always wanted to know about the effect of missing data on recovering topology using a Total Evidence approach is now available online (Open Access)!
This paper also deals with many different questions that people might be interested in (Bayesian vs. ML; how to compare tree topologies; comparing entire distributions, not only their means and variances; and many more!) but I’ll leave it to you to discover them…
Back in the mists of time, more than one and a half CPU centuries of calculations ago, Natalie and I wanted to build a Total Evidence tip-dated tree for Primates. The Total Evidence method is a method that allows you to combine both living and fossil species (or actually, read “both molecular and morphological data”) into the same phylogenies. The tip-dating method, is an additional method that uses the age of the tips rather than the age of the nodes for dating such a tree. But I’m not going to talk about that in this post.
At the start of the project, we were both confident that Primates would be the ideal group for such work since they are so well studied. A study that I described in a former post also came out around the same time, encouraging us in this project.
However, as you might guess, something went wrong, horribly wrong! For the Total Evidence method, we need molecular data for living species (check) morphological data for fossils species (check) and also for living species (che… No, wait)! After looking at the available data, we quickly found that there was a crucial lack of living taxa with available morphological data (see below). From that problem, came the idea of actually testing how that would influence our analysis. And funnily enough, this eventually became one of the two major parts of my PhD!
Running thorough (and loooooong) simulations, we assessed the impact of missing data on topology when using a Total Evidence method. We looked at three parameters where data could be missing:
- The first one, was obviously the one I introduced above: the number of living taxa with no available morphological data (at all!).
- The second one, was the amount of available data in the fossil record (because yes, the fossil record can be a bit patchy).
- And the third one, the overall number of morphological characters.
We then compared the effect of different levels of available data for each parameter individually and together on recovering the correct topology, using both Maximum Likelihood and Bayesian Inference. For the correct topology, we used the tree that had no missing data in our simulations. For each parameter combination, we measured the clades in common among the correct topology and the trees with missing data as well as the placement of wild-card taxa (typically fossils jumping everywhere).
Unsurprisingly, we found that the number of living taxa with no available morphological data was the most important parameter for recovering a good topology. In fact, once you go past 50% living taxa with no morphological data, the two other parameters have no effect at all, even if you have a perfect or a really bad fossil record or many or really few characters. This is kind of intuitive when you think about it because the only way to connect the fossils to branches with living taxa is to use the morphological data. Therefore, if there are no morphological data for the living taxa, the fossils cannot be grouped with them regardless of the quality of the data.
Paper 2 (Natalie)
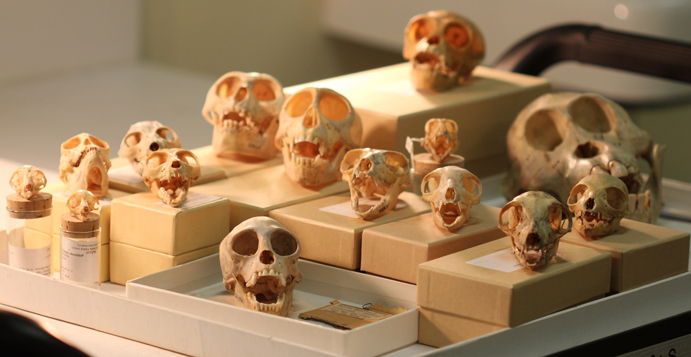
The second paper that we just published here attempted to quantify just how little data were available for living species. We focused on mammals, because they are well studied and I’m apparently a mammalogist (!), then downloaded all discrete morphological matrices containing any living and/or fossil mammal taxa from three major public databases. After a bit of data cleaning and fixing up taxonomic issues, we calculated the percentage of species with coded anatomical characters at three different taxonomic levels: family, genus and species. We consider groups with less than 25% of living taxa with available anatomical characters as having low data coverage, and groups with more than 75% of living taxa with available anatomical characters as having high data coverage.
Across mammals, species coverage was low (less than 25% of species with available coded anatomical characters), but family coverage was high (more than 75% of families with available coded anatomical characters). For each order, 11 out of 28 had low coverage and seven had high coverage at the species-level. At the genus-level, one order had low coverage and 15 had high coverage, and at the family-level, no orders had low coverage and 25 had high coverage (see the rather lovely Table 1 that Thomas made for more details). Primates are a good example where we expected good coverage - but only 16% of species had data (at the species-level) and there were no available data for Homo sapiens! A bit of a concern given the results of our first paper.
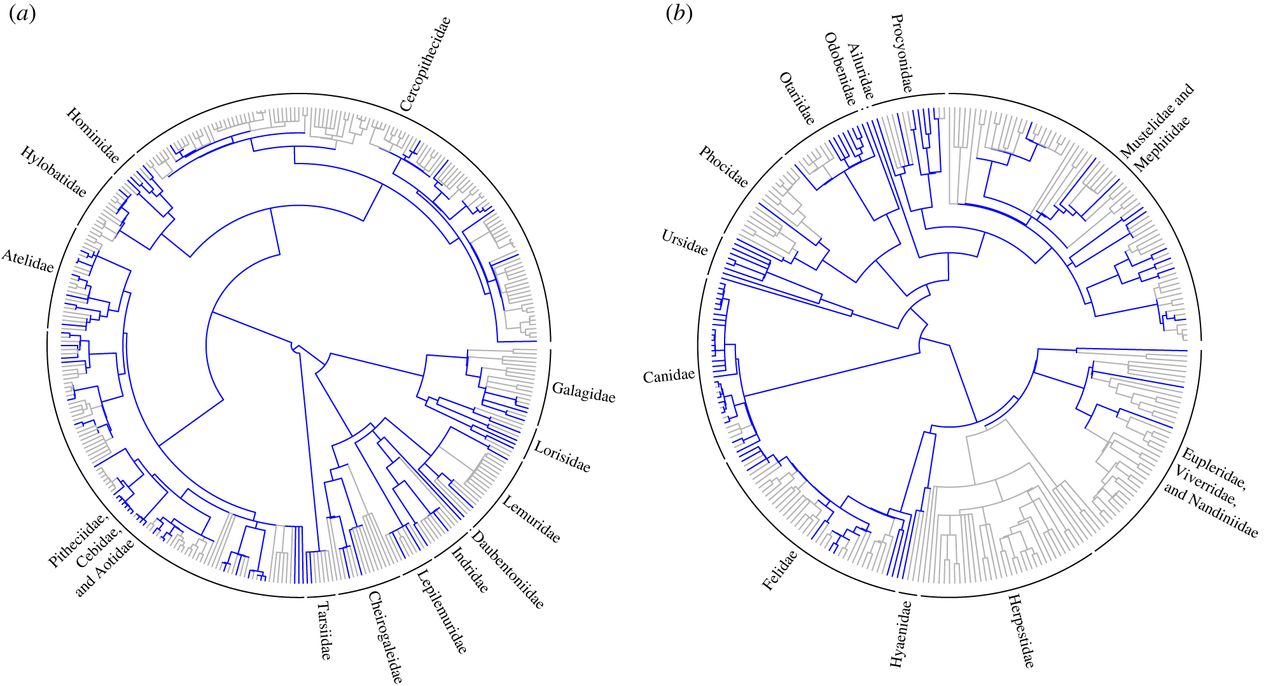
To investigate how problematic this might be we investigated whether the available coded anatomical characters were (i) randomly distributed, (ii) overdispersed or (iii) clustered, with respect to phylogeny, using two metrics from community phylogenetics. It’s not important to understand how these work, just that they tell you whether your species with data are evenly spread across the phylogeny, or clustered together. Why did we do this? Well, when few species have available coded anatomical characters, the ideal scenario is for them to be evenly distributed across the phylogeny to maximize the possibilities of a fossil being placed in the correct clade. The second best scenario is that species with available characters are randomly distributed across the phylogeny. Here, we expect no bias in the placement of fossils. Luckily we found that for most orders, species with available coded anatomical characters were randomly distributed across the phylogeny (for example see the Primates tree in Figure 1a below). The worst-case scenario for fossil placement is that species with available characters are clustered together on the phylogeny. Then, we expect two major biases: first, fossils will not be placed within a clade containing no data, and second, fossils will have higher probability of being placed within the most sampled clade by chance. Our results suggest that this may be problematic at the genus-level in Carnivora (carnivores), Chiroptera (bats) and Soricomorpha (shrews). For example, a carnivoran fossil is unlikely to be placed in Herpestidae (mongooses) because they have no coded anatomical characters available. Instead, the fossil will have a high probability of being placed on a branch that contains many anatomical characters, such as within the Canidae (dogs) or Ursidae (bears) (see Figure 1b below). This could be really problematic for downstream analyses. No-one wants a meerkat in with the grizzlies!
In conclusion (and in the words of Thomas’ original blog post), these papers taken together suggest that to improve our topologies in Total Evidence analyses, we should visit more Natural History museums. And not only the exciting fossil collections but the well curated collections of living species as well (a useful conclusion for Macro at the Museum)!
Thomas Guillerme (Imperial College London) and Natalie
@TGuillerme @nhcooper123
References
Paper 1: Guillerme & Cooper 2016 – Effects of missing data on topological inference using a Total Evidence approach, Molecular Phylogenetics and Evolution (doi:10.1016/j.ympev.2015.08.023).
Paper 2: Guillerme & Cooper 2016 – Assessment of available anatomical characters for linking living mammals to fossil taxa in phylogenetic analyses, Biology Letters (doi: http://dx.doi.org/10.1101/022970).
Code and slides
All the code for these papers is available on GitHub: Paper1 and Paper2.
Check out Thomas’ latest presentation about both papers from SVP, November 2014.